Introduction
Almost any successful trader will recommend using trading chart patterns. Without past price information, you are losing one of the most effective indicator tools available.
The past is a fantastic predictor of the future. Although you can never be sure in the trading world, you can add factual and statistical backing to your decision-making. Charting software is not reserved exclusively for stockbrokers and hedge fund managers; nowadays, anyone can access these tools and apply them to their trades. Some excellent chart indicators will take your trading skills to the next level if you are just starting!
What Are Trading Chart Patterns?
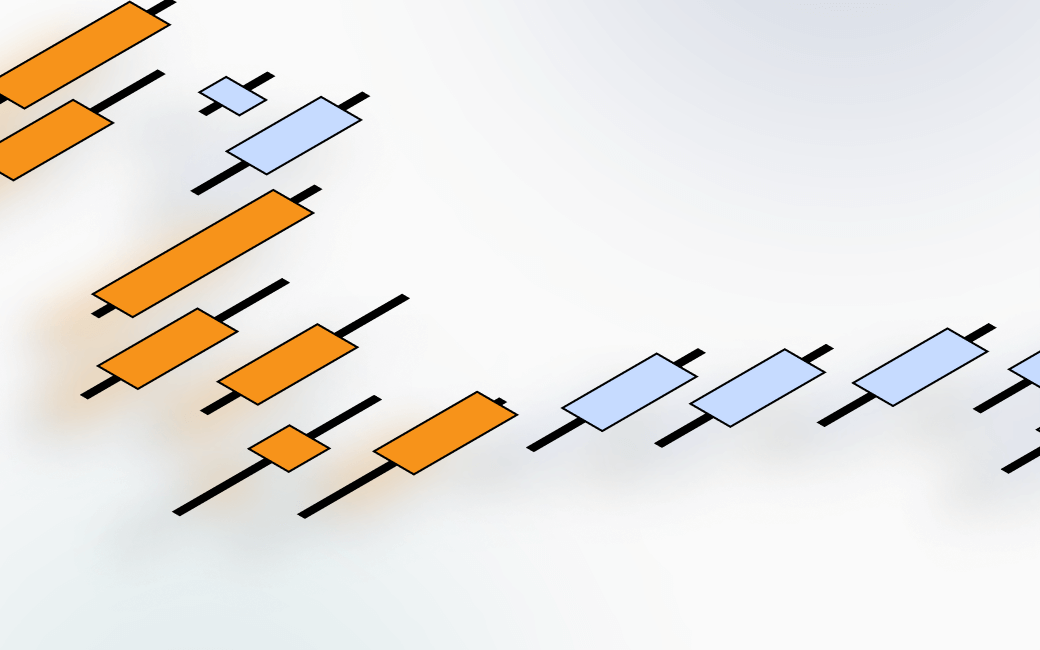
Trading chart patterns are shapes or trends in the price data of assets that indicate their future movements. There are two ways of spotting these “patterns.” The first is by simply looking at the charts to see ostensive signals, such as the double top or double bottom reversal chart patterns. Alternatively, you can use software to elucidate chart patterns and other information, which are harder to spot by eye.
There is a lot of chart indicator software freely available to use on the internet. Many trading platforms will include access to some of this software, but either way, you should not have to pay to use most of them. Don’t worry; you don’t need to use every chart indicator. If you choose your charting software carefully, just three or four can be adequate.
You will be able to find hundreds of chart data interpretations from social trading platforms, as well as social media, news, and blog sites. While it can be beneficial to see what other traders are saying, you should always take the advice of unknown traders and outlets with a pinch of salt.
The trading world is riddled with bias as, of course, there is a lot of money involved, and a lot of what is shared is designed to make you buy into a particular commodity, thereby boosting the price for them. By learning how to spot patterns by eye or by using charting software tools, you will be able to conduct your independent research and confirm what you read.
How do I Use Chart Patterns?
As mentioned above, there are two ways of finding chart patterns. The first way is to spot them simply by looking at the price charts. Naturally, you will need to know what to look for, and there are many patterns to know about. Double tops and double bottoms are two of the best known and easiest to notice. The double top chart pattern takes the shape of an “M,” and it signifies the beginning of a downward price trend. The double bottom is the exact reverse of this. You can spot it from its tell-tale “W” shape, which often precedes an upward trend in price.
Similarly, traders can find a triple top and triple bottom in charts with an “MN” (top) or “WN” (bottom) shape. If you can precisely locate these patterns, they have more than 70% accuracy at predicting the subsequent price movement. There are plenty more trading chart patterns that you spot by yourself. These include the “head and shoulders”, “island reversal”, “rounding top and bottom”, “wedge”, “rectangle”, “triangle”, “cup and handle” and “flag” patterns. If you don’t already know these, it won’t take you long to learn them, and they can often be the deciding factor in a trade.
Chart indicator software helps you find patterns hidden within the numbers. Different algorithms have been created to search for trends, volatility, momentum, volume, and more. Generally, their results are displayed as additional lines on the chart in question. The MACD (“Moving Average Convergence Divergence”) indicator is an excellent example of this.
By plotting three exponential moving averages onto a price chart, buy and sell signals can be inferred at certain intersections between the lines (plotted around the zero line of the chart). Again, with a bit of time, it’s surprisingly quick to get the hang of. Some other popular technical indicators are Bollinger Bands, Fibonacci Retracement levels, RSI (“Relative Strength Index”), Volume, ATR (“Average True Range”), Stochastic Oscillator, ADX (“Average Directional Movement”), and CCI (“Commodity Channel Index”).
Which is the Best Chart Pattern for Beginners?
If you’re new to using chart patterns, the double top and bottom (outlined above), head and shoulders, and cup and handle are all easy to learn and use. None of these patterns to spot by eye are difficult to understand, and they are all worth spending the time familiarizing yourself with. Most of the hard work is already done for you by the technical indicator software, and, similarly, they are all relatively straightforward with a bit of practice.
While some traders will use tens of charting software simultaneously, this is not necessary for beginners, and it can easily complicate the picture. Start by incorporating these four indicators: MACD, Stochastic Oscillator, Bollinger Bands, and OBV. MACD is great at determining trends. The Stochastic Oscillator helps you see the price momentum. Bollinger Bands is a volatility indicator. OBV (“On-Balance Indicator”) provides signals relating to the volume of buy and sell orders.
What are the Most Profitable Chart Patterns?
The most profitable chart patterns are the most reliable chart patterns. You cannot definitively say which chart pattern performs the best, although many traders will have their favorites. No single indicator is 100% accurate. When used in combination, however, they become much more effective price prediction tools. Among the technical indicators, it is best to spread them among the key areas of price analysis: trend, momentum, volatility, and volume. Accuracy will also depend on the strength of the signal itself.
For example, with a double bottom reversal chart pattern, the longer it has taken to form, the more likely it will be for the price to make a bullish upward trend. Learning to read charts correctly and properly interpret technical indicators will give you the best results with them. Remember not to rely solely on chart patterns. While they are excellent tools, traders should use them in conjunction with social indicators, market news, worlds events, and so on.
Where Can I Find Chart Patterns?
Many sites host trading price charts, allowing you to visualize different commodity price charts from varying marketplaces. You do not have to pay for the privilege of using this software. Some online brokers provide price charts, making it easier to navigate between your portfolio and other trading tools you may be using.
Chart indicator software can also be used online or downloaded for free. Similarly, some trading platforms will include access to several indicators. Sometimes you will find brokerages that give the summaries of technical indicators. For example, on a Bitcoin trading page, you may see a list of indicators (such as MACD and ADX) with their data consolidated into simple directions to “buy,” “hold,” or “sell.” Again, these can make your life much easier as a trader, but more important is that you utilize chart patterns effectively in your trades.
Conclusion
Trading chart patterns can give valuable insights, from present and past price data, about possible future movements of any given asset. Traders can find chart patterns with the naked eye as soon as they have learned what to look for. You can also use technical indicators to overlay a specific data analysis onto a price chart to elicit essential information about the commodity’s trading history. It is recommended to use at least three or four of these indicators (alongside a visual inspection) as part of your analysis.
MACD, Stochastic Oscillator, Bollinger Bands, and OBV would work well together as each one targets four of the essential areas for examination: trend, momentum, volatility, and volume. You can find all of these charting tools and software for free online, and some trading platforms may include them as part of their service. To get the most out of your trades, we invite you to try our online brokerage, “TradeOr.”
FAQ
- What Are Trading Chart Patterns?
Trading chart patterns come in one of two forms. Either they can be seen as shapes on price charts (such as double tops and double bottoms), or they are patterns that can be extracted using chart indicators (Bollinger Bands, for example).
- How Do You Use Chart Patterns?
Whether you are looking to learn chart patterns by eye or interpret the patterns elucidated by chart indicator software, they won't take you long to learn. As soon as you can see an example on a chart of how each one works, you will quickly be able to replicate them for yourself. If you can learn to spot ten or so chart patterns by eye and find out how to use at least three chart indicators, you will be well on your way to implementing statistical support to your trades.
- What Are The Best Chart Patterns?
It is impossible to say one chart pattern is better than another. This also applies to chart indicator tools. You can improve the accuracy of chart patterns by better understanding how to use them and using several at the same time in terms of indicators.
- What Is The Difference Between A Chart Indicator And A Chart Pattern?
"Chart patterns" are often used to refer to the patterns we can find ourselves by simply looking at the shapes on the price lines on a chart. There are also deeper "chart patterns," which are revealed by using chart indicators. Both of these are a means of effectively predicting a commodity's future price movements.
- Where Is The Best Place To Use Chart Patterns?
Price charts, upon which you can view price patterns, and chart indicators are both freely available to use online. Some online trading platforms also provide access to them. The best place for you may be a free site, or it could be more convenient to use the charts provided by your broker. We can certainly say the best place to put all of your trading know-how into practice is through our online brokerage, TradeOr.