
Introduction
Technical analysis makes up a large part of many trading strategies. Even if you are new to the financial markets, chances are you have heard that prices tend to move in technical patterns. And perhaps the most well-known chart pattern in trading is the double top and double bottom.
This market phenomenon has been a topic of many discussions between believers and skeptics. Still, to understand what it really is, it’s best we approach this trading strategy objectively and give a complete picture.
Double tops and double bottoms are first and foremost technical patterns. They indicate the so-called point of inflection, or the level at which the trend may reverse. A reversal, on that note, happens when price reaches a previous top or bottom. In other words, identifying these tops and bottoms correctly might give you bountiful rewards in trading.
So, is it possible to trade double tops and bottoms for a living? Let’s find out.
Double Tops Explained
A double top is a technical pattern, or a chart pattern, which indicates where an upside trend might meet resistance and turn around. Essentially, a double top is a trading signal to short the financial asset that has reached a previous peak.
There are certain requirements that must be met from an asset in order for the double top to be validated. In short, they are:
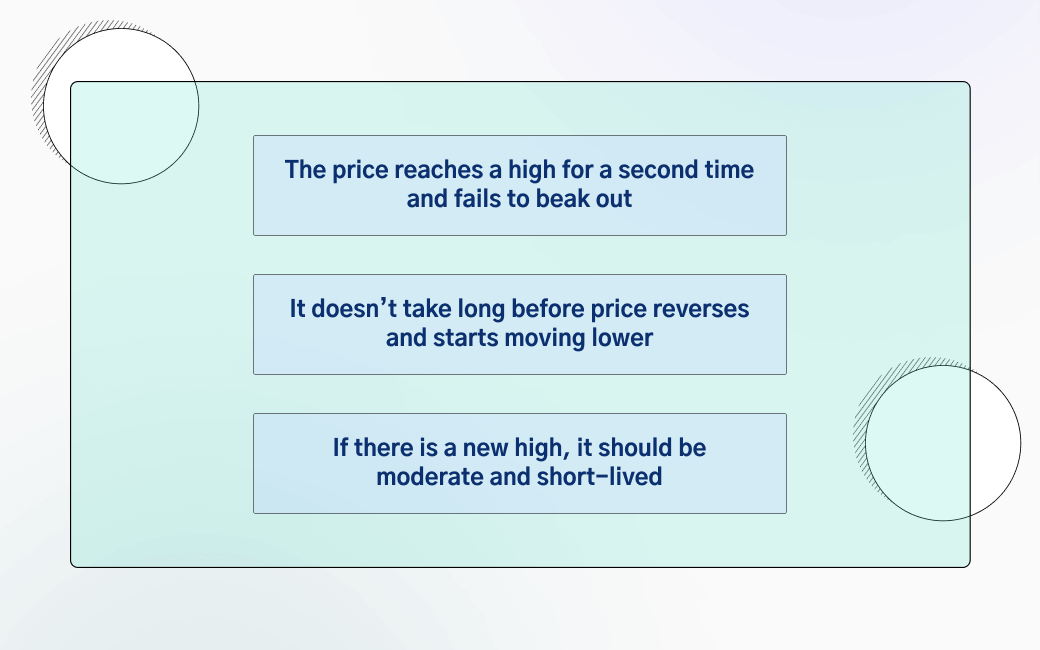
In more detail, a double top pattern would allow you to see if the market is gearing up for a pullback. No matter the financial asset in question, be it currencies, stocks, or crypto, all could create a double top formation.
How to Trade a Double Top?
Now to the million-dollar question, how do you trade double tops? There are several ways you can take advantage of this common technical style of trading. And they all look fairly easy to grasp.
First, monitor the uptrend of a price and make sure you have spotted the previous high. For example, if the EUR/USD has hit a six-month high of 1.2350, and has been in a downtrend since then, this is your first top. Or the one you need to pinpoint and watch.
Next, make sure the price is ticking higher and observe when it will reach the latest high of 1.2350. Once it lands, this is your signal to stay patient and follow price action. The price could essentially go in three directions. It could either break out and invalidate the double top pattern, or stay within the frame and reverse. But it could also do nothing and trade sideways.
Now comes the time to assess the situation and decide whether you want to pull the trigger and go short.
How Do I Know When to Go Short?
Obviously, if the price has breached the resistance level and is now significantly above the previous high, the double top has been invalidated. In our case let’s say the EUR/USD is now 1.2480, this would mean the reversal did not happen.
However, if the price remained confined within the previous high level, or moderately above by a few pips, the formation is intact. This means you can go ahead and place a short position on it. Make sure to put your stop-loss order slightly above the double top pattern so you would cover a small loss. That way you get exposure to an asymmetrical risk/reward ratio.
In other words, you can place your stop loss 30 pips above the double top, and take profit at 300 pips. This strategy will make sure you risk only $1 to make $10. Or you could be wrong 9 times out of ten and still come out even. This applies to the opposite side of the double top – double bottoms.
Double Bottoms Explained
A double bottom is a trading pattern that indicates where the trend may turn bullish, or start moving higher. It is formed by having two equal bottoms, the second one serving as the inflection point.
With this in mind, a double bottom would work the same as a double top but in reverse. You will be looking for the asset’s last low and see if the downward trend rebounds. In case it does, you can apply the same strategy you would for a double top, but in reverse. If it sounds confusing, let’s take it apart.
First, if the EUR/USD has made a low of 1.1250 six months ago and has been trading above it since, this is your first bottom. When price dips and touches this level, it could either trigger heavy buying and a rebound, or a breakout and a continuation to a new low. Also, as we said, price action could go on mute and trade around the flatline.
Regardless, you would have a chance to observe what the EUR/USD does and decide how to approach it.
Planning Your Trade in Advance

All this said, it’s crucial you plan your trade in advance. It is not recommended to decide on the spot what to do when you think you’ve seen a double top or bottom. No matter if it’s your money on the line, or someone else’s funds, be sure to carefully plan your moves ahead.
The strongest double tops and double bottoms are rare. They happen in the span of several months. For example, a top that happened six months ago would be more likely to contain the trend than a top from a week ago.
Some traders would also prefer to wait for the trend to reach the neckline. A neckline is the support level for a double top, or the resistance for a double bottom.
Others will look for the exact moment when price touches the previous top or bottom and open a trade with a tight stop. Whatever you may choose, make sure it fits your trading style and be sure to plan in advance. You can also combine this strategy with the Fibonacci trading method.
Summary
Trading double tops and double bottoms could pave your way to riches if you’re observant and patient. Even more so when the patterns are in sync with the Fibonacci retracements, a technique used to project potential support and resistance levels.
You have to keep in mind that most of the potential double tops and bottoms will fail to materialize. That’s why, make sure you don’t risk a high percentage of your account on any single trade. Still, there are beautiful double tops and double bottoms that go for months, potentially offering huge returns to your investment.
FAQ
- What is a double top?
A double top is a technical pattern, or a chart pattern, which indicates where an upside trend might meet resistance and turn around. Essentially, a double top is a trading signal to short the financial asset that has reached a previous peak.
- What is a double bottom?
A double bottom is a trading pattern that indicates where the trend may turn bullish, or start moving higher. It is formed by having two equal bottoms, the second one serving as the inflection point. Traders would pay attention to see if the second top meets the first one and open a long position if the trend reverses.
- What is the difference between a double top and a double bottom?
They are two opposite trading patterns. A double top is a bearish pattern, indicating a trend reversal into a lower leg. A double bottom is a bullish pattern, indicating a trend reversal into a higher leg.