
Introduction
“Support” and “resistance” are two of the most widely used concepts in trading. Understanding resistance trading is an essential part of technical analysis. Many traders use technical analysis to analyze the markets and predict the direction of prices. Plotting technical indicators onto price charts helps investors foresee trends and make their decisions.
Navigating the markets when your own money is on the line can be stressful. Financial websites and charting software can be a sea of confusing acronyms, and beginner traders may feel overwhelmed. The best strategy may depend on your own capital, time, and individual personality. That said, understanding support and resistance levels will go a long way in helping make that informed decision.
What is Support and Resistance?
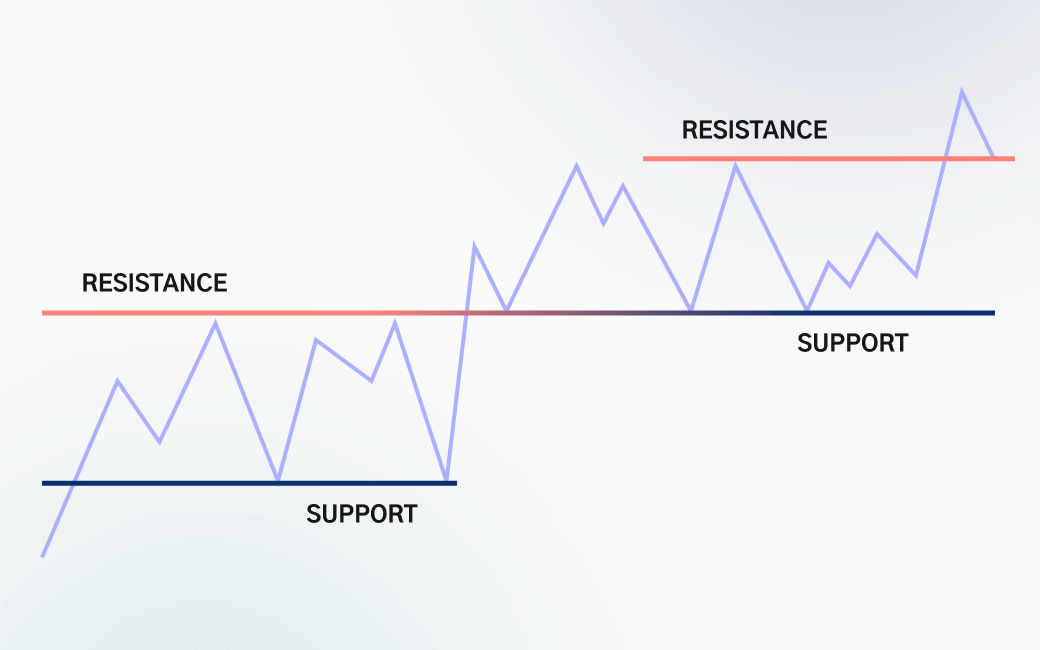
Support and resistance levels can be used when buying and selling all sorts of financial assets, including stocks, forex (currency pairs), and cryptocurrencies. What are resistance and support levels? Imagine a zigzag on a price chart. The upward tick is an area of resistance, with the highest point marking the point of an excess of sellers. On the flip side, the downward line will be an area of support, with the lowest point indicating a surplus of buyers. The price will move through these areas, and traders will buy and sell accordingly.
Resistance trading is an approach whereby investors plot support and resistance levels onto price charts. These zones help investors determine supply and demand and predict price action. Using technical analysis, traders will plot lines around the highest and lowest points. Imagine the price chart as a series of mountains and valleys – you want to find those “peaks and troughs”! In a nutshell, the idea is to buy (“go long”) when the price is in a zone of support and sell (“go short”) when the price hits an area of resistance.
Bounce Trading in Forex
You may hear about trading the “bounce” or riding the “break.” Forex traders may use trend lines and chart patterns to find the areas of resistance and support. When the price reaches these “S&R” zones, traders can use these areas as a bounce or break spot. Marking out these areas is also an important way to filter out other price movements, which can be distracting “noise” when reading price charts.
Trading the break: A break occurs when the price moves through the S&R levels. A breakout trade is when you buy when the price breaks through the resistance zone. Then you sell when the price breaks through the area of support.
Trading the bounce: A bounce is when the price does not have enough momentum to push through the support zone. Traders looking to “trade the bounce” will buy when the price drops to the support zone and sell when the price heads towards resistance.
Remember that resistance and support are interdependent of each other. These complementary concepts determine the maximum and minimum levels that the prices will reach. Think of the S&R zones as the ceiling and floor of the price building of your financial asset. The longer a price will resist breaking an S&R zone, the stronger the support and resistance level is. Accordingly, the price movement immediately after the break will be strongest after the most prolonged resistance. Once you understand the concept of S&R levels, you will open your trading strategy to the world of “trend lines” (upward, downtrend, etc.) and the inherent opportunities. Bear in mind that resistance and support can change roles; when the price pushes through resistance, this can become support, and vice versa. This phenomenon is known as “role reversal.”
Support and Resistance Trading in Forex
These two fundamental pillars of technical trading are instrumental when trading forex. The best way to begin resistance trading is to master the concepts of the aforementioned “bounce” and “break,” which we will cover in more detail below. Should you wait for the bounce, ideally, you want the price to reach the support level (“bouncing” off the “floor”) before entering. When break trading, you could take either a more forward approach, buying and selling whenever the price moves between an area of S&R. In this more forceful method, you would only enter after the price has moved through the zone. A more cautious approach would be to delay buying until the price has made a “pullback” (a temporary pause or drop in price action) to the support or resistance lines it had broken through. The trader would then enter only after the price has bounced. Think of these two ways as cowboys in a desert, one more trigger-happy and aggressive, the other holding fire and conserving ammunition.
Trend Lines
When traders talk about “trend,” they mean the direction of a price or financial asset. Investors using technical analysis will find the price trend by using “trend lines” in price charts. This brings us back to the pillars of support and resistance: identifying S&R zones goes hand in hand with trend lines.
An area of support occurs when a lack of demand prevents a downtrend. In reverse, when supply dries up, and the expected uptrend pauses, you will have a resistance zone. In technical trading, uptrends are drawn along the bottoms of “valleys” of support, while downtrends are drawn along the tops of the “mountains” of resistance. The lateral line that goes between the highs and lows is known as a “sideways trend.” You simply need to find the two major tops and bottoms and draw between them to plot trendlines.
Trendlines are used to help traders decide when to buy and sell assets. Most would use the price trend and buy accordingly (although “contrarians” would trade against the trend.) Be wary of placing too much in trendlines. The price may fall below the trendline yet continue to rise, and other indicators come into play when deciding the overall price action.
Find the Right Broker
S&R zones, trendlines, price charts – all these terms come under the wing of technical trading. The critical analysis and market data required by this approach to trading mean the platform you choose is key. Find a broker who gives you access to charting tools so that you can visualize market data and plot your technical indicators. Charting software is also a great way to learn a new market or backtest strategies. Of course, there is more to trading than charts and indicators. Ideally, you want a reliable platform with support, educational features, and competitive rates.
In that context, it is hard to beat our broker, TradeOr.com. Our clients have access to charting software TradingView and ChartIQ that is second to none. We make sure our customers have access to round-the-clock advice, with our customer support team available 24/7 to answer any questions you may have. Best of all, beginner traders can play around with our demo accounts. We will load your account with simulation money so that you can get comfortable using the platform before you risk your capital in live markets.
FAQ
- What Is Resistance Trading?
There are many ways to trade using levels of resistance and support. A simple example of resistance trading is where traders buy when the price is near support zones on an uptrend and then sell towards a downtrend or when the price hits a resistance level.
- What Is A Support Level?
In trading, a support level is the "floor" at which a price is unlikely to go below. Traders, therefore, tend to buy around these prices, making the identification of the support zone an important component of technical analysis.
- What Is A Resistance Level?
The resistance level is the price "ceiling," above which the price of an asset is unlikely to reach, caused by many traders selling at this point. “S&R” levels are one of the key concepts of technical trading, and therefore traders go to lengths to plot these zones on price charts or identify them using various indicators.
- What Is A Moving Average?
A moving average (MA) is one of many mathematical calculations traders use to "read" market data and predict future price trends. The moving average is used to smooth out fluctuations in price data and create an overall average price over a set period of time.
- What Does RSI Stand For?
In trading, RSI stands for "Relative Strength Index." This technical tool allows traders to estimate price action and momentum, resulting in a number between 1 and 100. When a stock price or other asset measures under 30, it could indicate too many traders are selling. Alternately, a result of over 70 suggests it could be being overbought.